In the world of UX, we often envision a smooth, effortless journey for our users. We design elegant paths, anticipate needs, and craft intuitive interfaces. Yet, the reality is that users don't always follow the ideal, straight line we've laid out. They encounter friction, hesitate, and sometimes, they drop off entirely. These points of friction, where users abandon a task or a process, are what we call UX bottlenecks.
Identifying these bottlenecks is paramount for improving user experience and achieving product goals. This isn't about guesswork; it's about data-driven insight. One of the most powerful tools for precisely locating these friction points is funnel analysis. By visualizing the user journey as a series of steps, we can pinpoint exactly where users are struggling, allowing us to focus our design efforts where they'll have the greatest impact.
What is Funnel Analysis?
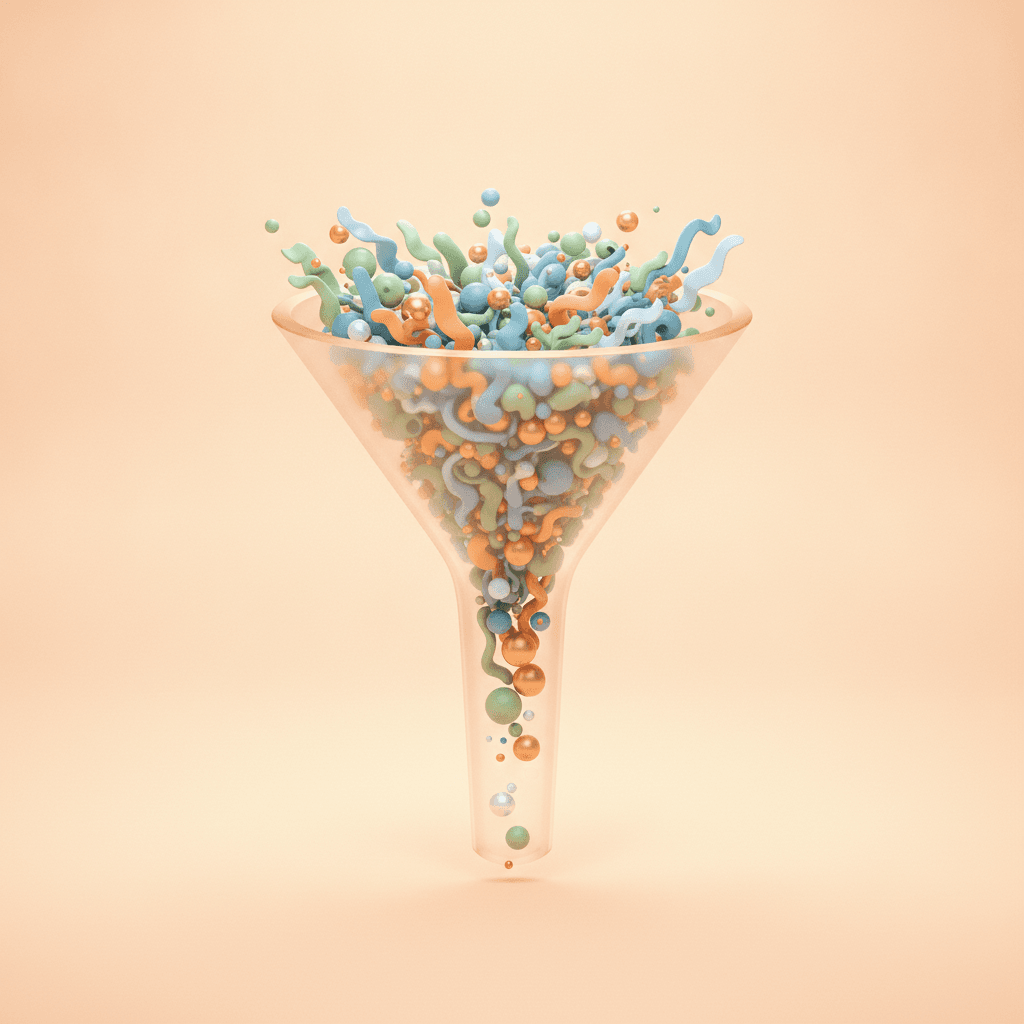
At its core, funnel analysis is a method for visualizing and measuring user progression through a predefined sequence of steps or events in a product or service. Imagine a literal funnel: users enter at the wide top and ideally flow smoothly through a series of narrowing steps until they exit the bottom, having completed a desired action. Each step represents a key interaction, and the width of the funnel at any point shows how many users are still progressing.
The primary purpose of funnel analysis is to identify where users drop off. By tracking conversion rates between each step, we can see exactly at what stage a significant number of users are leaving the intended path. This data provides a clear, quantitative view of friction points, moving beyond assumptions about user behavior to reveal the actual user journey.
Why is Funnel Analysis Crucial for UX?
For UX designers and product managers, funnel analysis is more than just a data point; it's a strategic imperative. It shifts the conversation from subjective opinions to objective, data-driven insights. Instead of guessing why users aren't completing a checkout process or signing up for a service, funnel analysis shows you precisely where the problem lies within that multi-step flow.
This precision allows designers to target their efforts effectively. If 50% of users drop off between 'add to cart' and 'start checkout,' you know exactly which part of the experience demands your immediate attention. This focused approach not only saves time and resources but also leads to more impactful design changes, ultimately improving user satisfaction, conversion rates, and business outcomes.
Furthermore, it helps prioritize design changes. When you have multiple areas for improvement, funnel data can highlight the most critical drop-off points, guiding you to tackle issues that will yield the biggest gains first.
Building Your First Funnel
Building a funnel begins with clearly defining the user journey you want to analyze and the ultimate goal you want users to achieve. Is it purchasing an item, signing up for a newsletter, completing an onboarding flow, or submitting a support ticket? Once the goal is clear, you identify the distinct, measurable steps a user *must* take to reach that goal. These steps should be sequential and clearly defined events that can be tracked by your analytics tool.
Consider an e-commerce purchase funnel: a user views a product, adds it to their cart, proceeds to checkout, enters payment information, and finally, confirms their order. Each of these is a step in your funnel. Missing or combining steps can lead to inaccurate insights, so be precise.
- Clearly define the user journey you want to track (e.g., 'new user onboarding').
- Identify distinct, measurable steps (events) in that journey (e.g., 'account created,' 'profile completed,' 'first action taken').
- Use your analytics platform (e.g., Google Analytics, Mixpanel, Amplitude) to track these specific events.
- Configure your funnel report within the analytics tool, ordering the steps sequentially.
- Set a clear timeframe for your analysis to observe trends over a specific period.
Interpreting Funnel Data: Spotting the Bottlenecks
Once your funnel is built, you'll see a visualization showing the number or percentage of users who complete each step. The most critical aspect of interpretation is identifying significant drops between consecutive steps. A steep decline in users from one step to the next is a clear indication of a bottleneck – a point where users are encountering friction and abandoning the process.
For example, if you observe a high drop-off rate between 'view product details' and 'add to cart,' it might suggest issues with product information clarity, pricing, or the visibility/call to action of the 'add to cart' button itself. Similarly, a bottleneck between 'checkout start' and 'payment information' could point to unexpected shipping costs, a complex form, or a lack of trust indicators.
Don't just look for the single biggest drop; sometimes, smaller, consistent drops across several steps can also signal a cumulative user experience issue that needs attention.
Beyond the Numbers: Deeper Insights
While funnel analysis excels at telling you *where* users are dropping off, it doesn't always tell you *why*. This is where its true power emerges when combined with qualitative research methods. Once you've identified a significant bottleneck, you need to dive deeper to understand the underlying reasons.
Tools like user interviews, usability testing, heatmaps, and session recordings become invaluable at this stage. If your funnel shows a drop at the 'payment' step, qualitative research might reveal that users are confused by the payment options, distrust the security indicators, or are frustrated by an unexpected technical error that isn't captured by simple event tracking. These insights allow you to move from 'users are leaving here' to 'users are leaving here because of X,' enabling targeted design solutions.
This holistic approach – quantitative data from funnels informing qualitative investigation – is the most effective way to diagnose and solve UX problems.
Actionable Strategies for UX Improvement
Once you've identified and understood the bottlenecks, it's time to design and implement solutions. The specific actions will depend on your findings, but here are common strategies to address various types of friction points:
If forms are the issue, simplify them by reducing required fields, using clear labels, and offering pre-filled options where possible. For clarity problems, revise your microcopy, improve calls to action, and provide helpful error messages or inline validation. If trust is a concern, clearly display security badges, offer transparent pricing, and provide guest checkout options. Performance issues might require optimizing loading times, especially on critical path steps, or ensuring your design is responsive across devices. Finally, always consider A/B testing different design variations to see which improvements positively impact conversion at the bottleneck step.
The key is to iterate: implement a change, monitor the funnel data again, and see if the bottleneck has improved. UX design is an ongoing cycle of discovery, design, and validation.
Funnel analysis is an indispensable tool in the UX researcher's and designer's toolkit. It provides a clear, data-driven lens through which to view and understand user behavior, transforming abstract design challenges into concrete, measurable problems. By meticulously tracking user journeys and identifying drop-off points, you can move beyond assumptions and make informed decisions that genuinely improve the user experience.
Embrace funnel analysis as a continuous process of observation, hypothesis, design, and testing. It empowers you to refine your product flows, reduce friction, and ultimately guide users more effectively towards their goals, creating more satisfying and successful digital experiences for everyone.
Sources & Further Reading
- Conversion funnel — Wikipedia
- User Flow: The Ultimate Guide — Interaction Design Foundation
- UX Research Cheat Sheet — Nielsen Norman Group
- What is a User Journey Map? — Interaction Design Foundation